Hi..My company is a CDN provider in Vietnam. We want to partner with CDN Planet and be listed on list of CDN providers on your website. I sent an email but I haven't received your reply. Can you check your email or reply my tweet? Thank you so much. Have a good day.
Starting May 2021, Google will take Core Web Vitals into account to determine rankings of pages in Google search results. Core Web Vitals is set of three page experience metrics: Largest Contentful Paint (LCP), First Input Delay (FID) and Cumulative Layout Shift (CLS).
Pages with poor Core Web Vitals scores may take a big hit and see traffic drop significantly. Site owners should have a firm grip on Core Web Vitals metrics and improve site speed where needed.
Cloudflare's site speed analytics service Browser Insights provides insight into Core Web Vitals (and more) to all customers for free.
This article is an in-depth review of Cloudflare Browser Insights.
Summary
Browser Insights is a free site speed analytics service by Cloudflare, providing website owners insight into Core Web Vitals and page load time. Positive features are ease of use and data freshness. The bad parts include the inability to view trends over time and no differentiation between desktop and mobile.
| Overall score |
|
| Usefulness |
|
| Ease of use |
|
Installation and Configuration
Browser insights is a new tool that lets you understand the performance of your web pages as experienced by your site visitors
Browser Insights provides insight into page load time and Core Web Vitals, based on data collected in the field (Real-User Measurements), currently from Chrome and Edge browsers only. Metrics are available per URL and for the whole site.
Benefits of using Cloudflare Browser Insights
Browser Insights tackles three major downsides of Google's Core Web Vitals data:
| Cloudflare Browser Insights | ||
|---|---|---|
| Data freshness | Metric values are updated daily | Metrics are updated as new data arrives |
| Time range | Past 28 days (rolling window) | Several time ranges can be selected, incl. last 6 hours/24 hours/week/month |
| Traffic threshold | No data available for low-traffic websites/pages | Low-traffic websites/pages get insights too |
Installation
Activating Browser Insights is a simple as clicking a toggle in the Cloudflare dashboard. Once the toggle is set to ON, Cloudflare automagically injects a JavaScript snippet into the page to collect the data.
Browser Insights Rules
Customers on the Pro plan and higher can use up to 100 rules to include/exclude requests that are measured with Browser Insights. This feature supports wildcard matching and allows for granular control over the data being collected.
Free plan customers can't configure rules: Browser Insights is simply on or off for your zone.
JS Code & Snippet
Adding more JavaScript to your website should always be a concern, especially if it's code from a third party. Third-party code snippets are known to be a major cause of page slowness.
Good news! The Cloudflare Browser Insights code is as good as it gets.
<script defer src="https://static.cloudflareinsights.com/beacon.min.js" data-cf-beacon='{"rayId":"626137cecba11fe2","version":"2021.4.0","si":10}'></script>
This script tag is injected at the bottom of the HTML and has the defer attribute, causing all browsers to load the JS file in a non-blocking way. Chrome/Edge browsers load and execute the script file with the lowest priority.
The Browser Insights JS code executes late during the page loading process so more important tasks finish first. The code itself takes little time to execute, even on low-end mobile devices.
Using Browser Insights on your website should not have a significant negative impact on how fast your pages load and respond to user input.
Compression and Caching
Cloudflare gets many things right with the Browser Insights JS code, but suprisingly fails to serve the JS code in an performance optimal way:
- No Brotli compression, just GZip
- No caching headers: browsers may not cache the file
- No Last-modified or ETag: browsers can't conditionally check expiry of the file
Hopefully someone at Cloudflare reads this article and fixes these three issues soon.
Metrics & Insights
Core Web Vitals
Metrics and Statistics
Browser Insights shows data for the three Core Web Vitals and uses the same buckets as Google: Good, Needs Improvement and Poor. The buckets in Browser Insights use the same thresholds as Google.
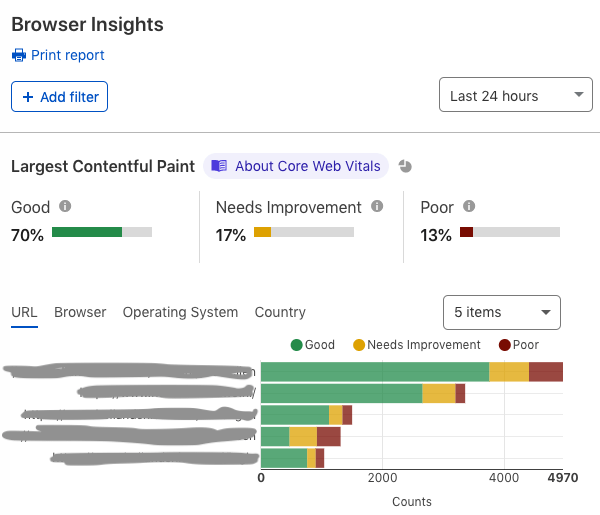
Unfortunately, Browser Insights does not show the 75th percentile (P75) for LCP, FID and CLS. Google's Core Web Vitals data in Google Search Console is based on the P75 and this should be interpreted as a strong signal the P75 is an important value to keep an eye on from an SEO perspective.
Sampling and Delays
The sample rate in Browser Insights is 10% of all page loads and this can't be changed, not even for Enterprise customers. For websites with low traffic, the 10% sample rate can be a real problem: the insights are not representative (= wrong).
The metrics in Cloudflare Browser Insights are updated in near real-time, enabling customers to see the impact of website changes on Core Web Vitals early. This is excellent and a big win over the data available from Google.
Dimensions and Filtering
Browser Insights provides some basic options for selecting data of interest and getting the desired insights.
| Feature | Notes | |
|---|---|---|
| Aggregate summary stats | Only the three buckets, not the P75 | |
| View trends over time | This is a major downside. You can't get the answer to a question like "did our LCP improve in the past 30 days?" | |
| Predefined time ranges | Last 30min/6h/12h/24h. Paid plan customers also get last week and last month | |
| Custom time range | Max 7 days for customers on the Free plan, longer for paid plan customers | |
| Daily granularity | No, only the aggregate for the selected time range (the three buckets) | |
| Hourly granularity | Only relevant to high-traffic sites | |
| Filter on URL | Select options are: equal, does not equal, contains | |
| More filters | Browser, OS and Country |
Data Visualization & Exporting
The UI is easy to understand and works well. +1 to Cloudflare for using a color palette that's friendly to people with color blindness.
The "Print report" feature works well (great looking printout) but missing is a 'Save as PNG' option for the charts and being able to export the data as JSON or CSV.
Documentation
The Cloudflare Browser Insights docs is a long page in the Cloudflare Help Center. The page provides sufficient information about enabling and configuring Browser Insights and explains how Page Metrics data is collected and what all the Page Metrics metrics mean. The Core Web Vitals explainer section is (too) short.
A real problem in the docs is the mention of Content Security Policy (CSP):
The Browser Insights performance beacon loads from https://static.cloudflareinsights.com/beacon.min.js and uses a third-party domain so that the script is cached across many website loads. You may need to update your Content Security Policy (CSP) settings to load this script.
This advice is incomplete: customers must also add https://cloudflareinsights.com to the connect-src directive to allow browsers to send the site speed data back to Cloudflare with navigator.sendBeacon.
Page Metrics
This section provides insight into total page load time (PLT) and into how long each loading phase takes (DNS, TCP, Request, Response, Processing). Data is collected using the browser's Navigation Timing API.
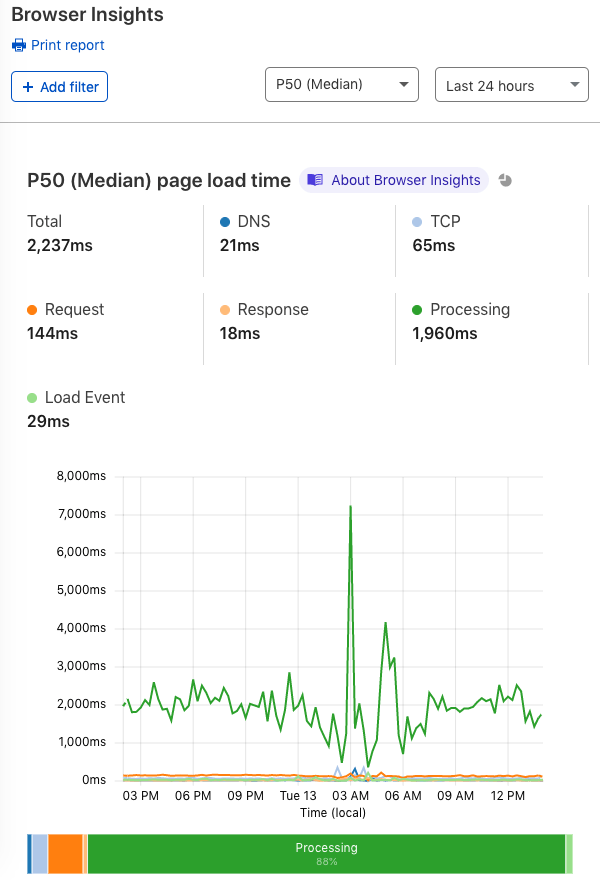
PLT is an old and deprecated site speed metric. It's generally agreed on in the web performance community PLT adds no value in understanding the quality of user experiences on webpages. It's useless, and in our opinion showing PLT data is worse than not showing it because making the data available implies it has value. In its current form, Page Metrics weakens Browser Insights.
Is there not any value in the data about each of the phases? Potentially yes, but not in Browser Insights because you can't view data for just one of the phases (ugh).
DNS. Measures how long a DNS query takes. Includes queries answered from browser/OS/resolver cache, so tells you nothing about how fast Cloudflare's DNS is.
TCP. Measures how long it takes to establish a connection with the server. Includes the TLS handshake time, making it harder to understand spikes and diagnose issues. Connect is a better name.
Request and Response. Time between sending out the request and receiving first byte (Request) and time between first byte and last byte (Response). Both metrics can be useful for spotting slow loading HTML responses, but - again - not here in Browser Insights because you can't zoom in on just one metric.
Processing. Measures how long it took to render the page, including the loading of any resources that block page rendering. For most pages on the Web, this is the phase where the browser spends the most time. Without any further details about what happened during this phase and how long each task took (layout, painting, JS execution, etc), just the processing time is useless.
In the docs, Cloudflare hints on improving Page Metrics:
Cloudflare plans to provide more detailed analytics for the Processing metric in the future.
Waterfall charts showing timing data for everything that loaded on the page? JS execution time? We'll have to wait and see what Cloudflare comes up with.
Key Improvement Points
Core Web Vitals
- Show trends over time
- Show the P75 value
- Differentiate between desktop and mobile
- Use a higher sample rate for sites with low/medium traffic levels (customer can set the sample rate, or Cloudflare auto-tunes self)
- Add metrics like First Contentful Paint. Cloudflare's JS is not on par with the JS that Google provides (open source) to measure all of the Core Web Vitals as well as all the other Web Vitals that can be measured in the field
Page Metrics
Remove it. Page Metrics is a distraction.
Closing Notes
It's unclear what Cloudflare's ambition is with Browser Insights. If Cloudflare wants to provide small/medium-sized customers with a nice little freebie then Browser Insights is perhaps good enough (minus the Page Metrics), but if the ambition is to help large/enterprise customers have solid, actionable RUM powered insights into Core Web Vitals/site speed then a lot of work needs to be done to get the service to a competitive level.